US Legal Immigration by Year: Trends and Statistics
Author Name: Nahyan | uslawguide
Last Updated: June 29, 2025
The United States has historically been a nation of immigrants, and the flow of legal immigration plays a significant role in its demographic, economic, and social fabric. Understanding US legal immigration by year involves analyzing the number of individuals who obtain Lawful Permanent Resident (LPR) status, commonly known as a “Green Card,” each fiscal year. These figures reflect not only the demand for immigration but also the impact of immigration laws, policies, and global events. Many rights extended to LPRs are rooted in protections enshrined in the US Amendments Bill of Rights. For detailed annual immigration statistics, refer to the Department of Homeland Security’s Office of Immigration Statistics:Here.
What Constitutes “Legal Immigration”?
When discussing “legal immigration,” we primarily refer to individuals who are granted Lawful Permanent Resident (LPR) status. This includes:
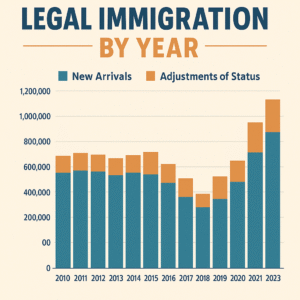
New Arrivals: Individuals who are admitted to the U.S. with an immigrant visa issued by a U.S. embassy or consulate abroad.
Adjustments of Status: Individuals already in the U.S. (e.g., on a temporary visa) who apply for and are granted LPR status without leaving the country.
Legal immigration pathways primarily fall under family-sponsored, employment-based, diversity visa (lottery), and humanitarian categories (refugees and asylees adjusting to LPR status). These pathways are often shaped by constitutional protections outlined in the US Amendments Bill of Rights. For official descriptions and application criteria, consult the U.S. State Department’s immigrant visa categories page:Here.
Key Sources for Annual US Legal Immigration Data
The primary authoritative sources for US legal immigration data by year are federal government agencies:
- U.S. Department of Homeland Security (DHS) – Office of Homeland Security Statistics (OHSS): This is the main source for comprehensive immigration statistics. They publish the annual “Yearbook of Immigration Statistics,” which includes detailed tables on Lawful Permanent Residents, nonimmigrant admissions, refugees and asylees, naturalizations, and enforcement actions. Their data is generally reported by fiscal year (October 1 to September 30).
- U.S. Citizenship and Immigration Services (USCIS): USCIS is part of DHS and processes most immigration applications. They also publish data and reports related to green card applications, naturalizations, and other immigration benefits.
- U.S. Department of State: This department is responsible for issuing visas at U.S. embassies and consulates abroad, and they publish visa statistics, including immigrant visas issued.
- Pew Research Center, Migration Policy Institute (MPI), and USAFacts: These are reputable non-governmental organizations that analyze and present official government data in accessible formats, often providing valuable context and trend analysis.
Recent Trends in US Legal Immigration by Year
While exact numbers can fluctuate based on data revisions and the specific definition used (e.g., total foreign-born population vs. new LPRs granted), the general trends in annual legal immigration to the U.S. have hovered around 1 million LPRs per fiscal year for much of the past two decades, with notable shifts influenced by policy changes, economic conditions, and global crises.
Here’s a general overview of trends, drawing from various sources, focusing on the number of Lawful Permanent Residents (new Green Card grants):
- Pre-2000s: Legal immigration generally increased after the Immigration and Nationality Act of 1965 removed national-origin quotas, leading to higher numbers throughout the late 20th century, often surpassing 1 million annually in the 1990s.
- Early 2000s (Post 9/11): There was a period of tightened security measures and slightly fluctuating numbers following the September 11, 2001, attacks, though the overall legal immigration flow remained substantial.
- 2010s: Annual legal immigration largely maintained levels around 1 million to 1.1 million LPRs. For instance:
- FY 2015: Approximately 1,051,031 LPRs.
- FY 2016: Increased to around 1,183,505 LPRs.
- FY 2017: Dropped slightly to 1,127,167 LPRs.
- FY 2018: Further declined to 1,096,611 LPRs.
- FY 2019: Maintained a similar level at 1,031,765 LPRs.
- Early 2020s (Pandemic Impact): The COVID-19 pandemic and associated travel restrictions and policy changes significantly impacted immigration flows, leading to a temporary decline in new LPRs:
- FY 2020: Saw a decrease to around 707,362 LPRs due to pandemic-related restrictions.
- FY 2021: Remained lower, around 740,789 LPRs.
- Post-Pandemic Rebound (FY 2022-2023): Immigration numbers rebounded sharply as restrictions eased and processing capacity increased, reflecting a clearing of backlogs and continued demand:
- FY 2022: A significant increase to 1.06 million to 1.1 million LPRs (numbers vary slightly by source but show a strong rebound). Notably, more than 2.6 million authorized immigrants (including temporary and LPRs) came to the US, with LPRs being a significant component.
- FY 2023: The total foreign-born population reached a record 47.8 million, with the immigrant population growing by over 1.6 million from 2022 to 2023. While specific final LPR numbers for FY2023 are often released later in the year, the trend indicates continued high levels of legal immigration. For instance, reports indicate that immigration was the primary driver of the nation’s population growth between 2022 and 2023.
Key Factors Influencing Annual Numbers:
- Immigration Laws and Policies: Congressional acts (e.g., Immigration Act of 1990), executive orders, and changes in visa processing priorities directly affect the number of immigrants admitted.
- Economic Conditions: Both in the U.S. and in countries of origin. Economic downturns in the U.S. can reduce demand for employment-based visas, while economic hardship abroad can increase the desire to immigrate.
- Global Events and Crises: Humanitarian crises, conflicts, and natural disasters can lead to increased refugee and asylum applications, which, if granted, can eventually result in LPR status. For example, recent years have seen parole programs for individuals from Afghanistan, Ukraine, Venezuela, Cuba, and Haiti which, while not direct LPR grants, represent significant authorized arrivals that may lead to permanent status later.
- Visa Backlogs: For many family-sponsored and some employment-based categories, demand far exceeds the annual numerical limits set by US immigration law. This creates extensive backlogs, meaning that a visa “becomes available” years or even decades after the initial petition, impacting the year in which LPR status is actually granted.
- Processing Capacity: The resources and efficiency of government agencies like USCIS and the Department of State in processing applications can influence the number of LPRs granted in any given year.
Where Do Legal Immigrants Come From?
Historically, the sources of US legal immigration have shifted significantly. While European countries were dominant in the 19th and early 20th centuries, post-1965 immigration has been primarily from:
- Asia: Consistently a leading source, including countries like India, China, and the Philippines. In FY2022, Asia accounted for nearly 43% of legal immigrants (approximately 1.1 million people).
- North America: Primarily Mexico, but also Central American and Caribbean nations. Mexico remains the top country of birth for the overall immigrant population in the U.S.
- Latin America (excluding Mexico): Countries like El Salvador, Cuba, the Dominican Republic, and Venezuela have seen significant increases in recent years.
- Africa: Countries like Nigeria and Bangladesh have also contributed growing numbers.
Importance of Tracking Legal Immigration Data
Annual US legal immigration data is vital for:
- Policy Making: Informs legislative debates and helps policymakers assess the impact and effectiveness of current immigration laws and propose reforms.
- Demographic Planning: Helps demographers, economists, and urban planners understand population growth, labor force dynamics, and service needs.
- Economic Analysis: Provides insights into the contributions of immigrants to the U.S. economy, including labor supply, entrepreneurship, and consumption.
- Public Understanding: Offers objective data to counter misinformation and foster informed public discourse on immigration.
Conclusion
The landscape of US legal immigration by year is a dynamic reflection of a nation continually shaped by its immigrant population. While annual numbers fluctuate due to a complex interplay of US immigration law, global events, and economic forces, the consistent arrival of around one million new Lawful Permanent Residents each year underscores the enduring allure of the United States and the structured nature of its legal immigration system. Accessing and understanding these official statistics provides invaluable insight into one of the most fundamental aspects of American society.
Frequently Asked Questions About US Legal Immigration by Year
Q: What is the difference between “immigrants” and “lawful permanent residents” in statistics? A: “Immigrants” (or “foreign-born”) often refers to anyone residing in the U.S. who was born in another country, regardless of their legal status (naturalized citizens, LPRs, temporary visa holders, or unauthorized immigrants). “Lawful Permanent Residents” (LPRs) specifically refers to individuals who have been granted official permanent legal status, evidenced by a Green Card. Annual statistics for LPRs track the number of new Green Cards granted each fiscal year.
Q: Does “legal immigration” include undocumented immigrants who gain status? A: Yes, if an undocumented immigrant successfully applies for and is granted Lawful Permanent Resident status through a legal pathway (e.g., marriage to a U.S. citizen, asylum grant, certain visa categories), they are then counted as a legal immigrant (LPR) in the year their status is adjusted. However, the annual LPR numbers do not include the flow of unauthorized entries.
Q: Where can I find detailed historical data on US legal immigration? A: The most comprehensive source is the U.S. Department of Homeland Security’s (DHS) Office of Homeland Security Statistics, particularly their annual “Yearbook of Immigration Statistics.” Organizations like the Migration Policy Institute (MPI) and Pew Research Center also offer historical data and interactive charts based on these official sources.
Q: How do global events, like conflicts, affect legal immigration numbers? A: Global conflicts and humanitarian crises can significantly impact legal immigration. They often lead to an increase in refugee and asylum applications. If these individuals are granted asylum or refugee status, they can eventually adjust to Lawful Permanent Resident status, contributing to the legal immigration numbers in subsequent years. New parole programs may also be implemented in response to specific crises, allowing individuals to enter legally outside of traditional visa categories, with some potentially adjusting status later.
Q: Are there limits to how many people can immigrate to the U.S. each year? A: Yes, US immigration law sets numerical limits (caps) on most categories of family-sponsored and employment-based immigrant visas each fiscal year. There are unlimited visas for “immediate relatives” of U.S. citizens (spouses, unmarried children under 21, and parents of adult citizens). The Diversity Visa lottery also has an annual cap. These caps contribute to visa backlogs, where demand exceeds available visas, resulting in waiting periods for many immigrants.
Responsible Disclaimer: This article provides general information and historical trends about US legal immigration by year. It is not intended as legal advice. US immigration law and its statistical reporting are highly complex and subject to change. For the most current data, specific legal interpretations, or advice on individual immigration matters, readers should consult official government sources (DHS, USCIS, State Department) or a qualified immigration attorney licensed in their jurisdiction.